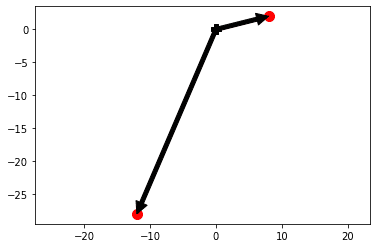
Steps to get a gradient vector.
- given equation: f(x,y) =
- first, cal with respect to x and y each. Then you will get a two derivative equations
\begin{equation} \nabla (f)= \begin{bmatrix} 4x+6y-26\ 6x+14y-54 \end{bmatrix} \end{equation}
-
second, choose the point where you want to get a slope each. Then apply the point.
-
x=7,y=1
- then you will get an (8,2) which is a slope of each derevative.
-
- at last, try to get a gradient vector by calculating the following :
import numpy as np
import matplotlib.pylab as plt

black = {'facecolor':'black'}
def g(x,y):
    return (4*x+6*y-26, 6*x+14*y-54)
g1 = g(7,1)
g2 = g(2,1)

plt.plot(0,0,'kP',ms=10)
plt.plot(g1[0],g1[1],'ro',ms=10)
plt.annotate('',xy=g1,xytext=(0,0),arrowprops=black)
plt.plot(g2[0],g2[1],'ro',ms=10)
plt.annotate('',xy=g2,xytext=(0,0),arrowprops=black)

plt.axis('equal')
plt.show()
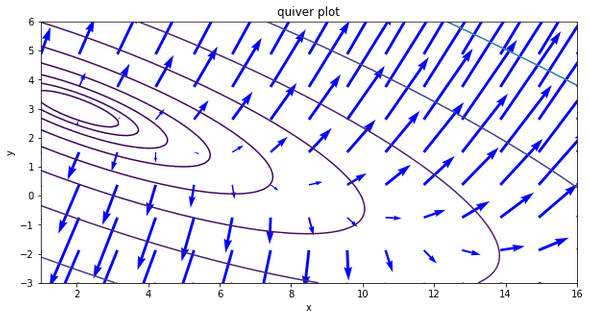
Following graph is to show the function : f(x,y) =
def f(x,y):
    return 2*x**2+6*x*y+7*y**2-26*x-54*y+107
xx = np.linspace(1,16,100)
yy = np.linspace(-3,6,90)
X,Y = np.meshgrid(xx,yy)
Z=f(X,Y)

def gx(x,y):
    return 4*x+6*y-26
def gy(x,y):
    return 6*x+14*y-54

xx2 = np.linspace(1,16,15)
yy2 = np.linspace(-3,6,9)

X2, Y2 = np.meshgrid(xx2,yy2)
GX = gx(X2,Y2)
GY = gy(X2,Y2)
plt.figure(figsize = (10,5))
plt.contour(X,Y,Z, levels=np.logspace(0,3,10))
plt.quiver(X2, Y2, GX, GY, color='blue', scale=400, minshaft=2)

plt.xlabel('x')
plt.ylabel('y')
plt.title('quiver plot')
plt.show()
